
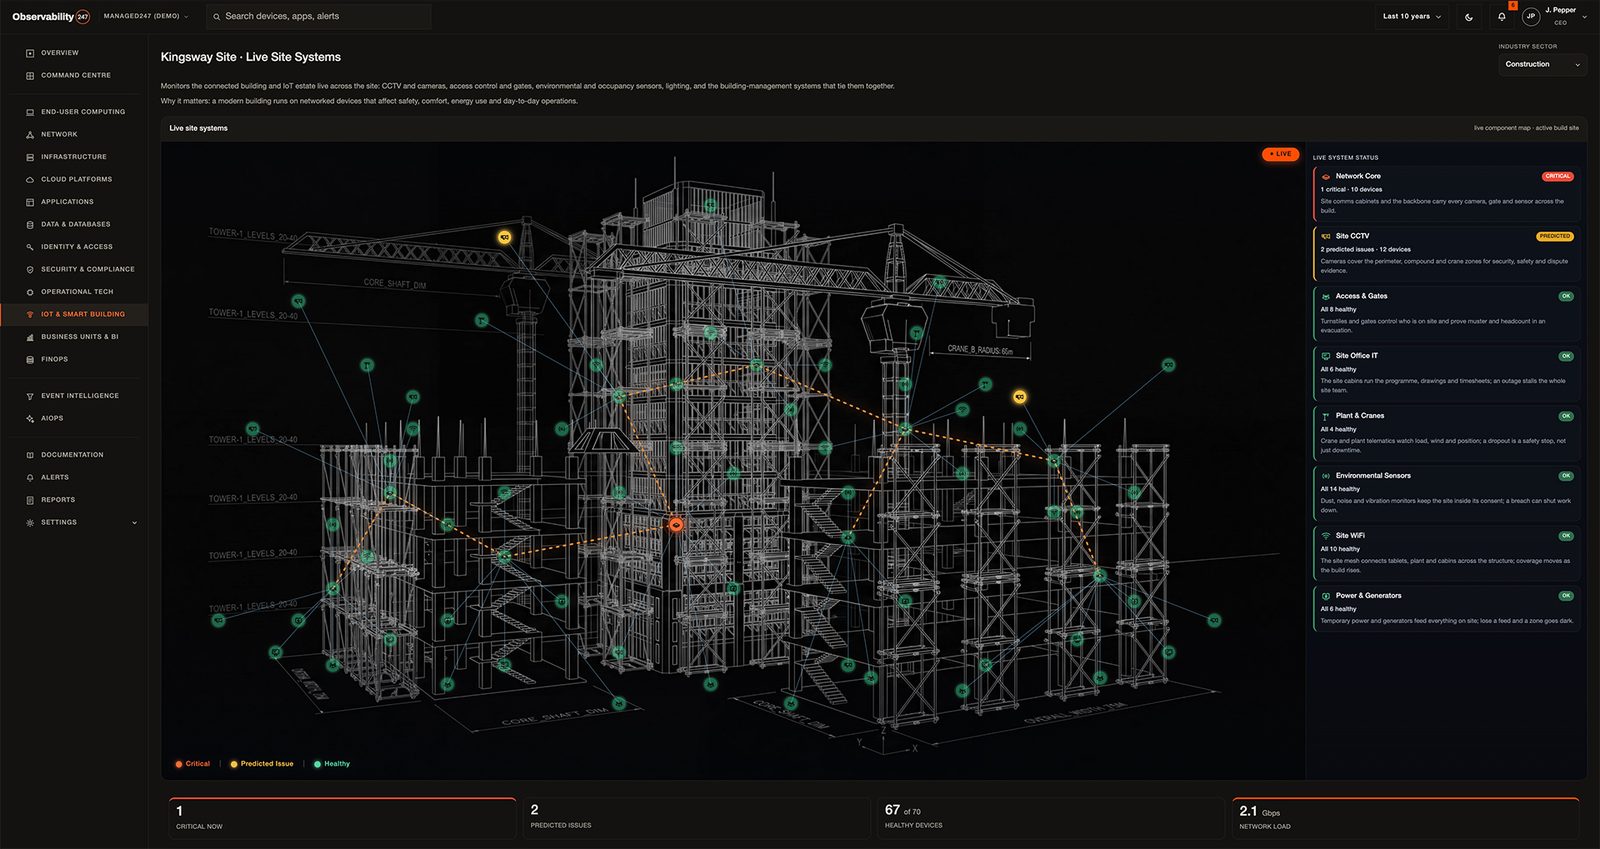
A genuine single pane of glass gives your operations team one place to see, understand and act on the health of your entire technology estate. More than that, it doesn’t just display information; it connects the dots between systems, correlates related events and prioritises alerts, so you can focus on the most urgent stuff first.
Almost every monitoring provider claims to offer a single pane of glass. But in practice, many simply bring a handful of dashboards together into a single interface. That’s useful, but it isn’t what the term really means. Here’s everything you need to know about the single pane of glass concept and what a genuine one looks like.
What is a single pane of glass?
In IT monitoring, a single pane of glass is a unified interface that brings together monitoring and management across your technology estate. It allows your team to see everything in one place, instead of switching between separate tools for servers, networks, cloud infrastructure and applications.
Many providers describe their products as a single pane of glass because they aggregate data from multiple sources onto one dashboard. While that’s certainly an improvement on having dozens of disconnected screens, aggregation alone doesn’t solve the operational challenge. If your engineers still have to jump between different tools to investigate an incident, correlate alerts manually or decide which issue is most pressing, all you’ve really done is move the dashboards into one browser window. That’s not true unified visibility.
Why has the term been done to death?
“Single pane of glass” has become a convenient marketing phrase because everyone wants the same outcome: less complexity. Modern IT environments are no longer confined to a single data centre, with most organisations managing a combination of:
- On-premises infrastructure
- Public cloud platforms
- SaaS applications
- Remote users
- Hybrid networks
- End-user devices
- Operational technology (OT)
- Internet of Things (IoT) devices
- Physical building systems
Each of these environments brings its own specialist monitoring tools, and the result is tool sprawl. Instead of one coherent view of service health, your team might well find themselves moving constantly between different dashboards, each showing a small piece of the overall picture.
A dashboard that simply collects widgets from those systems doesn’t eliminate the problem – all it does is change where the dashboards are displayed. Many providers claim the single pane, yet fall short with partial coverage, a lack of correlation and the swivel chair between consoles that the single pane was meant to eliminate.
A real single pane of glass isn’t just a dashboard
Look at it another way: a single pane of glass isn’t a wall of dashboards. A wall of dashboards is still lots of different tools. A single pane is just one.
To draw the distinction further, all a dashboard shows you is information. A genuine single pane of glass helps you actually understand what’s happening. Rather than simply collecting alerts, it correlates them.
Say a network switch fails. Without correlation, your monitoring tools may generate separate alerts for network connectivity, application availability, server health, user experience and storage performance. Your service desk will suddenly receive dozens, maybe even hundreds, of alerts for what’s actually just one underlying issue.
A true single pane of glass recognises that these events are related. Rather than presenting every individual symptom, it surfaces the root cause, allowing your team to focus on resolving the real problem instead of working through a wall of duplicate notifications.
What should a single pane of glass actually cover?
For unified visibility to be meaningful, it needs to extend beyond traditional IT infrastructure. It should be able to monitor:
Endpoints
Laptops, desktops and mobile devices remain the front line of many support issues. Visibility into endpoint health is essential for maintaining productivity.
Networks
Routers, switches, wireless infrastructure and connectivity remain the backbone of every digital service.
Applications
Business-critical applications need continuous monitoring so that issues affecting users can be identified before they escalate.
Cloud environments
As workloads continue moving into Azure, AWS and other cloud platforms, monitoring must extend seamlessly across hybrid environments.
Operational Technology (OT)
Manufacturing equipment, industrial control systems and operational infrastructure increasingly sit alongside traditional IT, but they’re often monitored separately.
Internet of Things (IoT)
Connected sensors and smart devices generate huge volumes of operational data that can provide early warning of developing issues.
Physical estate
Building management systems, CCTV, environmental monitoring and other physical infrastructure are becoming increasingly connected – yet they’re still excluded from many monitoring platforms.
This broader coverage is where many organisations discover that their “single pane of glass” isn’t quite as comprehensive as they expected.
Context matters as much as data
The challenge for IT teams today isn’t a lack of information; if anything, it’s the opposite. Modern monitoring tools generate vast amounts of data and alerts every minute. Without context, that information quickly becomes noise. Engineers spend valuable time figuring out whether multiple alerts are related, identifying the root cause and deciding which issue should be addressed first.
Not with a true single pane of glass. Rather than simply presenting everything that’s happening across your environment, it correlates events from different systems and presents them as meaningful incidents. Instead of asking your team to interpret dozens of disconnected alerts, it helps them understand what those alerts mean and how they relate to one another. The result: faster investigation, quicker resolution and less time spent chasing symptoms instead of causes.
The most effective monitoring platforms don’t just tell you that something’s failed – they help you understand the business impact of that failure. A single pane of glass should enable your team to prioritise incidents based on the services they support, the users they affect and their operational impact.
This allows IT teams to make faster, more informed decisions instead of reacting to whichever alert appeared first. It can also provide the clean, correlated data needed to support intelligent automation – whether that’s routing incidents to the right team, triggering predefined remediation or identifying trends before they become service-impacting problems.
Is a single pane of glass right for every organisation?
Not necessarily. Smaller organisations with relatively simple environments may find that a handful of integrated monitoring tools provide all the visibility they need.
As infrastructure grows, however, complexity increases rapidly. Hybrid cloud environments, remote users, SaaS platforms, connected devices and operational technology all introduce new data sources, new dashboards and new management challenges. At that point, the value of a unified operational view becomes much clearer, reducing the time your team spends switching between tools, manually correlating information and trying to understand what’s really going on.
What should you look for in a single pane of glass monitoring provider?
If you’re comparing monitoring platforms, it’s worth looking beyond the “single pane of glass” label and asking a few practical questions:
- Does it monitor your entire technology estate, including cloud, networks, endpoints, OT and IoT?
- Can it correlate related events into a single incident?
- Does it prioritise issues based on business impact?
- Can it integrate with your existing monitoring and ITSM tools?
- Does it provide meaningful insights rather than simply displaying more dashboards?
- Can it support future automation and AI initiatives?
The answers to these questions should tell you whether it’s a real “single pane of glass” that you’re dealing with. Remember, it’s not just about having everything on one screen – it’s about giving your operations team a single trusted view of what’s happening across your IT systems (all of them), a single place to investigate issues and a single source of truth for making operational decisions.
That means moving beyond dashboards towards genuine observability – bringing together data from across your technology estate, correlating events, reducing noise and providing the context your teams need to act quickly and confidently.
That’s the thinking behind Observability247. Rather than adding another monitoring tool to the stack, it provides unified visibility across IT infrastructure, cloud environments, operational technology, IoT devices and your physical estate, helping you cut through the complexity and focus on keeping critical services running smoothly before your business feels the impact. Why not explore the options?
Frequently asked questions
What does “single pane of glass” mean in IT?
A single pane of glass is a unified interface that brings together monitoring and management data from across your IT environment. Rather than switching between multiple tools, it lets you monitor systems, investigate incidents and understand service health all in one place.
Is a dashboard the same as a single pane of glass?
Not necessarily. A dashboard displays information, but a true single pane of glass goes further by correlating alerts, identifying root causes and providing context and prioritisation so that your team can resolve issues more efficiently.
What are the benefits of a single pane of glass?
A well-designed platform can reduce alert fatigue, improve visibility across complex environments, speed up incident response and help IT teams focus on business-critical issues rather than isolated technical alerts.
What should a single pane of glass include?
A single pane of glass should extend beyond servers and networks to include cloud services, applications, endpoints, operational technology, IoT devices and even elements of the physical estate. Bringing these together provides a more complete view of operational health.
Why is a single pane of glass important?
It cuts the time teams spend switching between tools, shortens incident resolution and removes the blind spots that let small faults grow into outages — provided the coverage and correlation behind it are genuine. Without real unified visibility, a “single pane” is just a tidier collection of the same disconnected dashboards.
Does a single pane of glass include OT and IoT?
It should, though many don’t. Bringing operational technology, IoT sensors and connected physical systems such as CCTV and building management into the same view is exactly where genuine unified visibility is won or lost — and it’s the coverage most monitoring tools miss.